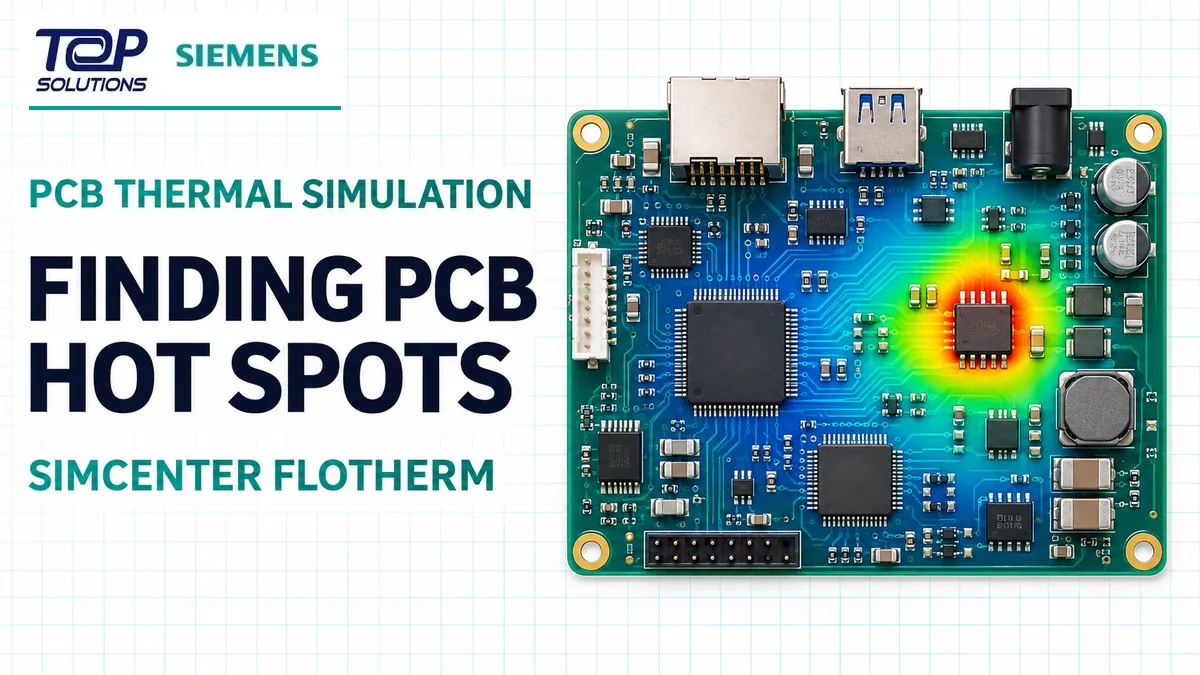
A PCB hot spot depends on more than the power of one component. Placement, copper heat paths, package properties and airflow all influence operating temperature. This illustrative workflow shows how to set up and interpret a board-level study in Simcenter Flotherm.
Scope: the dimensions, power inputs and boundary conditions below are assumptions for teaching the workflow. No solver has been run for this example, so the article does not claim a calculated temperature or performance gain.
1. Define the PCB and heat sources
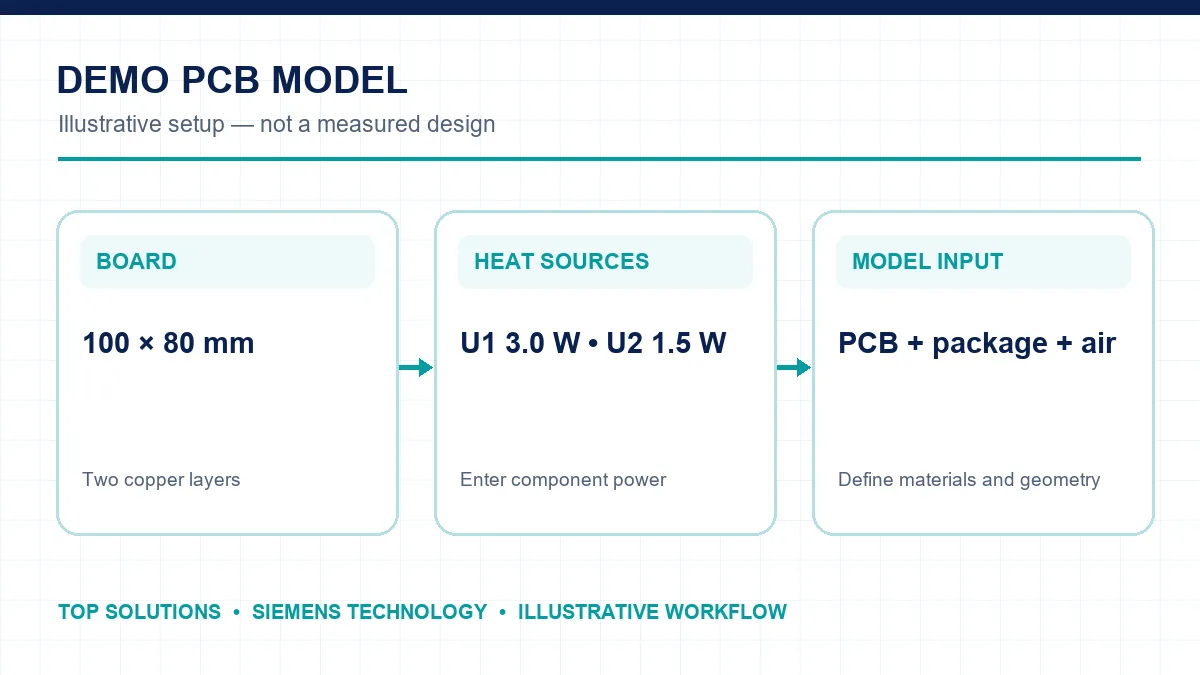
Assume a 100 × 80 mm two-copper-layer board with U1 dissipating 3 W and U2 dissipating 1.5 W. The model needs board and component geometry, copper and substrate materials, package thermal properties, component position and operating power. The 4.5 W total is an input, not enough by itself to calculate a maximum temperature.
2. Set comparable cooling conditions
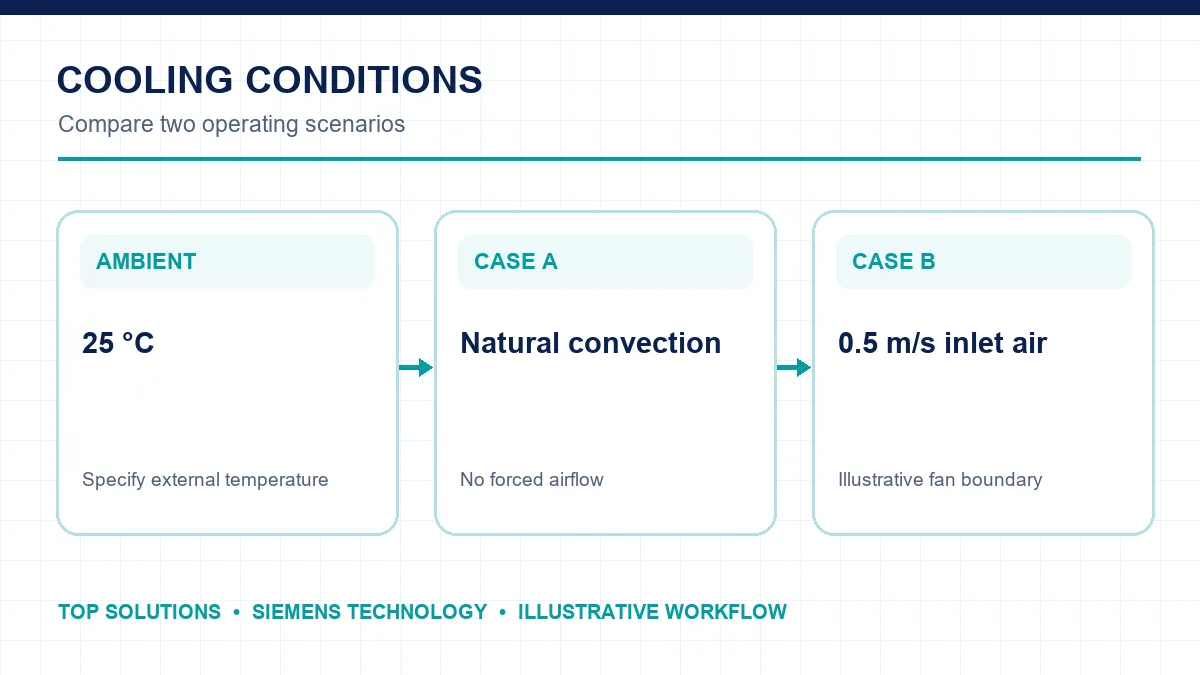
Use the same geometry and heat loads for two cases: natural convection at 25 °C ambient, and an illustrative 25 °C inlet with 0.5 m/s airflow. For an enclosed product, represent openings, clearance above components and fan position. Changing several conditions at once makes the source of any temperature difference unclear.
3. Interpret the hot spot
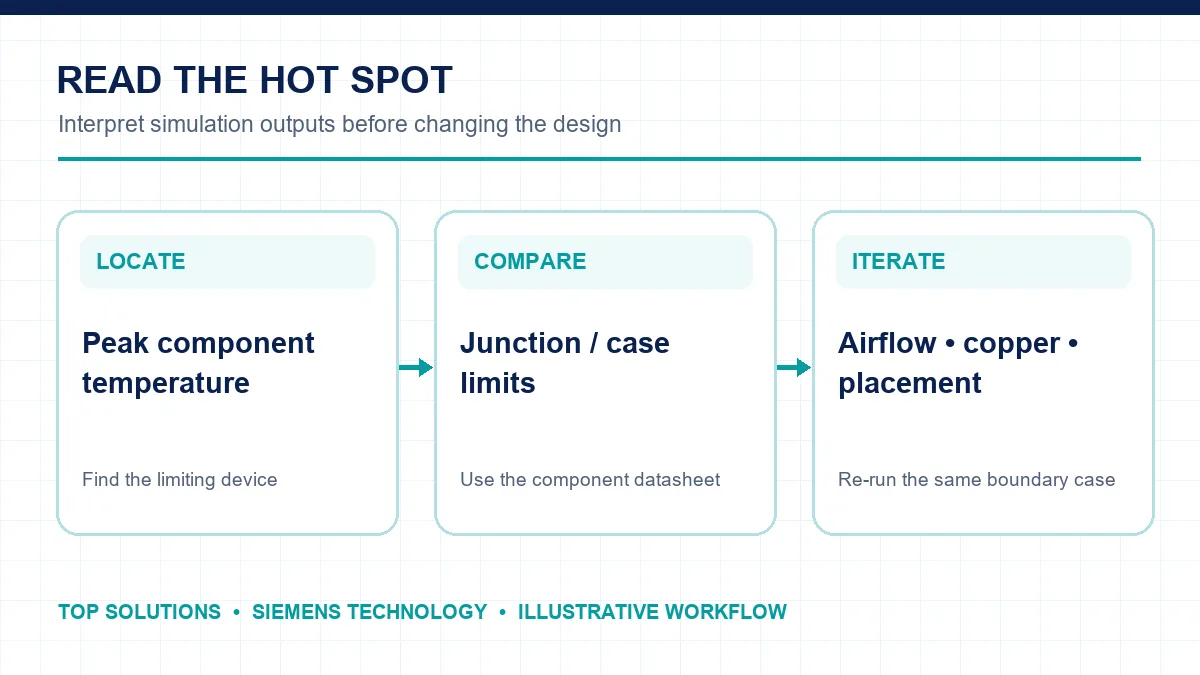
After solving, inspect each component’s maximum temperature and the board temperature map. Compare the relevant junction or case temperature with that component’s datasheet limit. Airflow plots help reveal stagnant regions; a lower-power device can still run hotter if its cooling path is poor.
If U1 exceeds its limit, test one change at a time: more copper or thermal vias, component relocation, improved venting or a different fan flow. Re-run the same boundary case and record the numerical peak temperature. Keep the color scale fixed when comparing heatmaps.
Where Flotherm fits
Flotherm addresses electronics cooling from IC packages and PCBs to equipment enclosures. For broader fluid and thermal problems, explore the Simcenter portfolio.
Frequently asked questions
Can 3 W alone determine component temperature?
No. The heat path, ambient conditions and cooling arrangement are also required.
Why lock the heatmap color range?
Automatic rescaling can make two plots appear similar even when their peak temperatures differ.
Technical source: Siemens Digital Industries Software – Simcenter Flotherm trial.